
There are two powerful stories in this chart. One is about growth. The other is about inequality. In the global emissions arms race of the last few decades, billions of people have been lifted out of poverty, thanks in large part to fossil fuels. The result has been a runaway increase in CO2 emissions; the main cause of global warming, and as a consequence, climate change. But many have been left out — and if they want to follow the same path to prosperity as the rest, it’s game over for the climate.
Because emissions are strongly linked with economic growth (leading to higher energy use), we can gain a good picture of this by looking at countries that have experienced strong economic growth, and by grouping these also according to their political and economic characteristics.
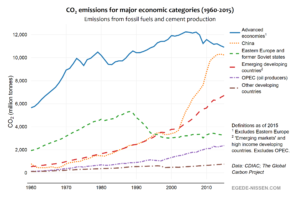
Through the 1980s, the advanced economies lead the growth in emissions. ‘Advanced’ in this context means mature, market-based, highly industrialized and rich countries. They include the developed countries in Europe, North America and East Asia/Pacific (complete list of countries found below). The graph also captures the growth in emissions in territories that have only recently joined the advanced economies, like Singapore and South Korea. The goal is to capture the growth of countries that are currently in the group of advanced economies because new entrants, in making the transition, also became heavy polluters.
There are some countries that could be included in the group of advanced countries, but have not been. That’s because of their unique economic fortunes, which have had interesting consequences for their emissions profiles. These are the countries in Eastern Europe formerly under the thumb of the Soviet Union, plus its break-away republics. When the Berlin Wall fell, they entered a brutal transition from planned economies to capitalism (still incomplete in many countries), leading to wrenching economic crash as they struggled to adapt. That also lead to a crash in their emissions. And because their economies were so polluting and based on inefficient use of fossil energy, their emissions have (fortunately) never picked up again. That crash, starting in about 1990, is clearly visible in the chart. Thanks to the end of the Cold War, their path towards becoming emissions juggernauts was cut short.
It used to be that greenhouse gas emissions were produced mostly by the developed countries, but that time has passed. During the 1980s, the locus of emissions growth started moving east, mainly to Asia. Since then, many developing countries — they can be called ’emerging developing countries’ — have climbed high on the energy and emissions ladders [1]. The group consists of what economists have called ’emerging markets’, which have distinguished themselves through strong economic growth in the last two decades, plus other high income countries in the Global South, including India, Brazil, Thailand, Malaysia, the Philippines, and of course China. Not all of these, such as Argentina, Chile and Bahrain, can really be called developing countries anymore — but nor have they yet joined the advanced economies. Others, like Pakistan, remain desperately poor, but have fast-growing economies.
China stands out in this group because of its size and the stupendous growth in its emissions (and has earned its own line). Since late 1978, China has been on a path of ‘reform and opening up’, with the main goal of growing the country’s economy, which then was lying in ruins. In fact, China was the third-poorest country in the world, by per capita national income, when Deng came to power. Its economic growth since then has been staggering — and so have, by extension, its energy use and emissions. China overtook the United States in 2007 as the largest emitter of CO2 from fossil fuel and has not look back. Today, China is responsible for nearly one third of all fossil fuel CO2 emissions.
Another group that deserves special attention is OPEC, the Southern oil cartel. The 14 countries in this group have also experienced rapid emissions growth, albeit not as much as the other emerging developing countries. What is unique about their situation is that their emissions growth is fuelled by oil production and the availability of cheap, abundant oil. The graph hides big differences within this group: some, like Saudi Arabia and the United Arab Emirates, have become shockingly oil dependent, relying on oil both to drive their GDPs, fill their state coffers, and generate cheap electricity. Saudi Arabia alone, a country of merely 30 million, emits 1.8% of total global CO2 emissions. That’s four times as much CO2 per person as the world average, and more even than the US and Canada. Because of their oil dependence, OPEC has been ruthlessly antagonistic to global efforts to reduce emissions, because even successful mitigation elsewhere could lead to reduced oil demand and reduced profit margins.
In fossil fuel emissions, most OPEC countries are well on their way to becoming the advanced economies’ equals — or more. But a large and amorphous group of developing countries have not been able to join the global emissions party, seeing neither significant economic growth nor emissions growth. This group (the ‘other developing countries’ in the graph) counts more than 100 countries and 1.2 billion people. When considering the relative emissions of this group — their emissions per person — it comes out at just 0.67 tonnes (670 kilograms) per person per year, far below the world average of 5.5 tonnes per person.
So to answer the question in the title of the post: emissions now come from all corners of the globe. If there’s any good news in the graph, it’s that emissions in the rich world have been trending downwards for a few years now. In the case of the US, the decline in emissions has been entirely inadvertent, a consequence of the country’s switch from dirty coal to considerably cleaner natural gas. There are also signs that China is getting close to ‘peak emissions’. If we want to avoid a climate apocalypse, it’s clear that developing countries cannot continue down the same carbon intensive path to industrialization as they have been, and which the West used previously. But who will help them?